Grafana K6
Loading Test
Load testing is a form of software testing that puts a simulated workload on a system — application, API, or website — to see how it performs. It helps organizations ensure their system can handle expected workloads while maintaining a stable, high-quality user experience.
負載測試,又稱壓力測試,是模擬大量用戶使用服務下,觀察服務的乘載能力的一種測試模式。
主要目的是確保軟體、應用程式或是網站在高流量或大量數據處理時仍能正常運作,可以顯示出系統的瓶頸、性能下降的點以及潛在的故障區域。
Introduction
k6 是用 Go 語言編寫的一種高效能的負載測試工具,具有以下特點:
- 易於使用的 API 和 CLI
- 使用 JavaScript 來撰寫測試腳本
- 有一系列負載測試會用到的 JS Libraries,方便調用
- 有 IO blocking,在發出 HTTP 請求時,不需要用
await控制流程
- 自動化測試,能將效能測試整合到 CI/CD 工具中
Grafana k6, written in Go Language, is an open-source load testing tool that makes performance testing easy and productive.
Types of load testing
k6 針對負載測試本身,依照不同的測試目標,定義出了以下測試類型:
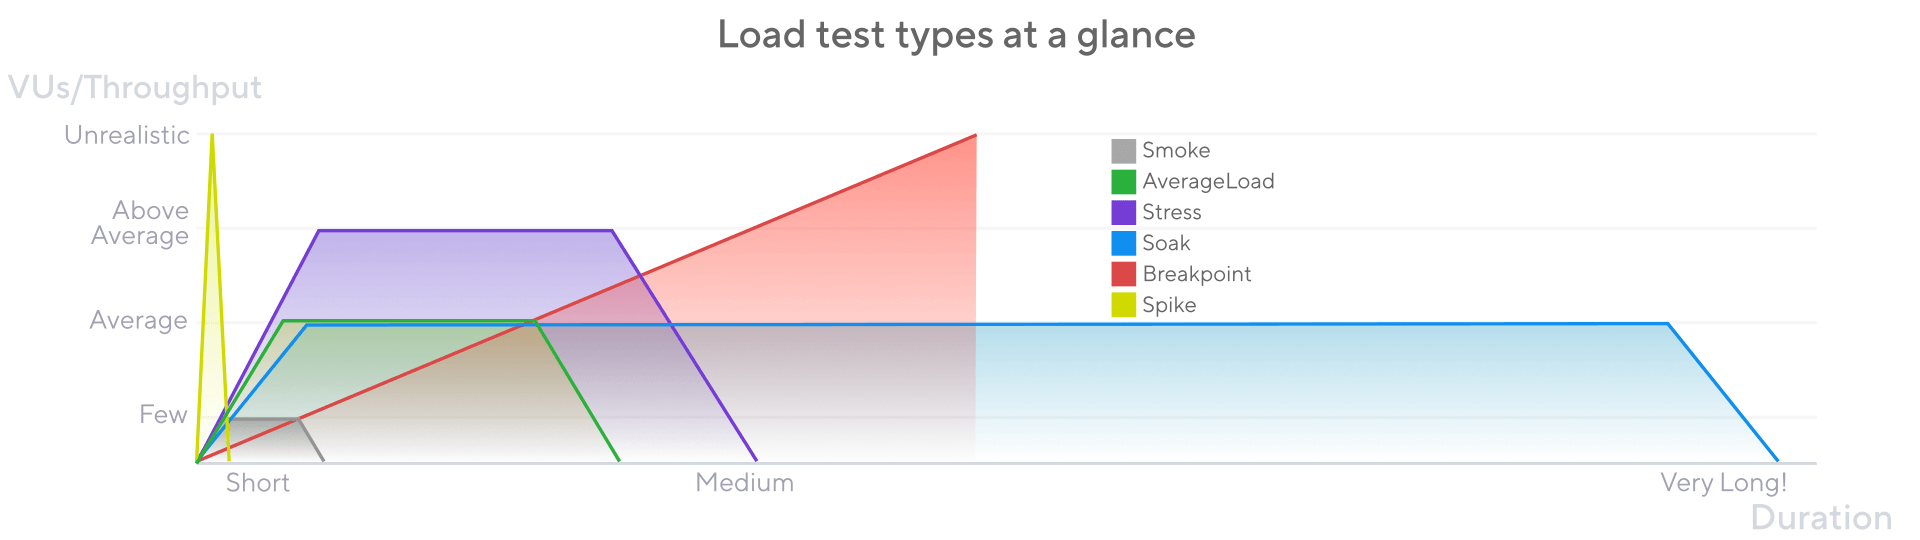
- Smoke test:驗證系統在最小負載下的功能,通常是測試腳本與服務的功能或邏輯正確。
- Average load test:了解系統在正常流量下的運作。
- Stress test:了解系統在高流量下的運作。
- Spike test:了解系統在突然性高流量下的運作,是指驗證更極端的流量條件下服務的表現。
- Breakpoint test:透過逐步增加流量的方式,以利發現效能下降的點、系統的瓶頸,以及淺在的故障區域。
- Soak test:驗證系統在長時間的正常流量運作下,是否出現效能下降。
Usage
Installation
# MacOS
brew install k6

# Window
choco install k6

# Docker
docker pull grafana/k6
Scripts
一個基本的 k6 測試腳本:
在 10 秒內模擬 5 個虛擬用戶持續向
https://test.k6.io發送 HTTP GET 請求。每次請求後,每個虛擬用戶都會暫停 1 秒再發送下一個請求。(以模仿真實用戶的行為模式)
import http from 'k6/http';
import { sleep } from 'k6';

// 設定的參數
export const options = {
    vus: 5,
    duration: '10s',
}

// 執行測試腳本的函式
export default function () {
    http.get('https://test.k6.io')
    sleep(1)
}
也可以透過 CLI 直接執行:
k6 run --vus 5 --duration 10s script.js
Options
-
vus:虛擬用戶的數量。
-
duration:測試運行的總持續時間。
-
iterations:測試腳本函式被執行的次數。
# 已持續時間為主,會出現時間到了但腳本執行次數未符合設定的情況
k6 run --vus 5 --duration 10s --iteration 100 script.js -
stages:在特定時間內增加或減少用戶數量的執行方式。
script
./script.jsimport http from 'k6/http';
import { check } from 'k6';
export const options = {
stages: [
// 一階段:15 秒內逐步將用戶加到 10 位
{ duration: '15s', target: 10},
// 二階段:一分半內逐步將用戶從 10 位增加到 30 位
{ duration: '1m5s', target: 30},
// 三階段:10 秒內逐步將用戶從 30 位降為 0 位
{ duration: '10s', target: 0},
]
}
export default function () {
http.get('https://test.k6.io')
check(res, {
'status was 200': (r) => r.status == 200
})
}CLI
k6 run --stage 15s:10, -s 1m5s:30, -s 10s:0 ./script.js -
rps:所有虛擬用戶每秒發出的最大 Request 數量。
Result
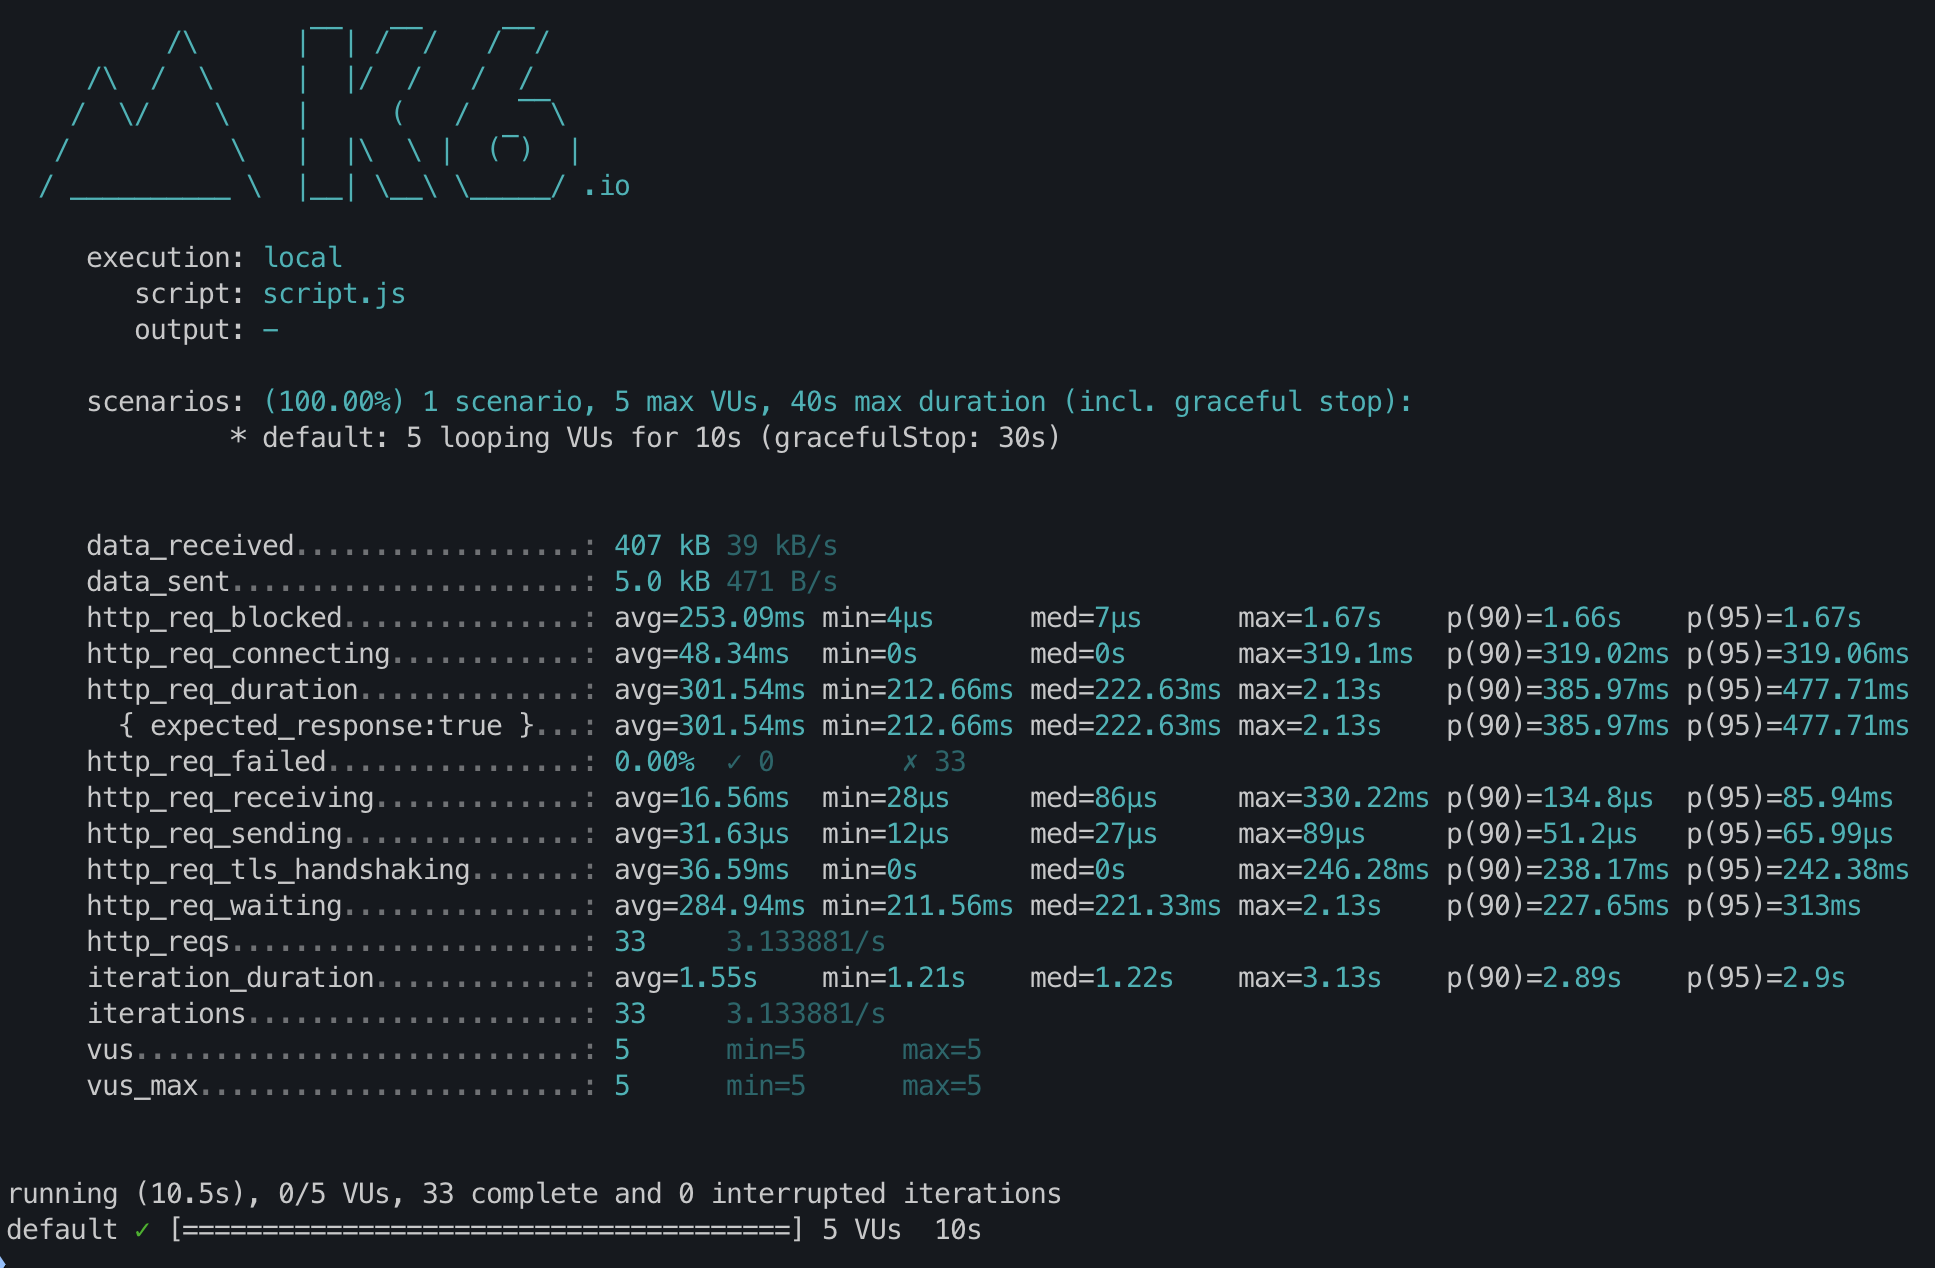
執行指令
k6 run ./script.js
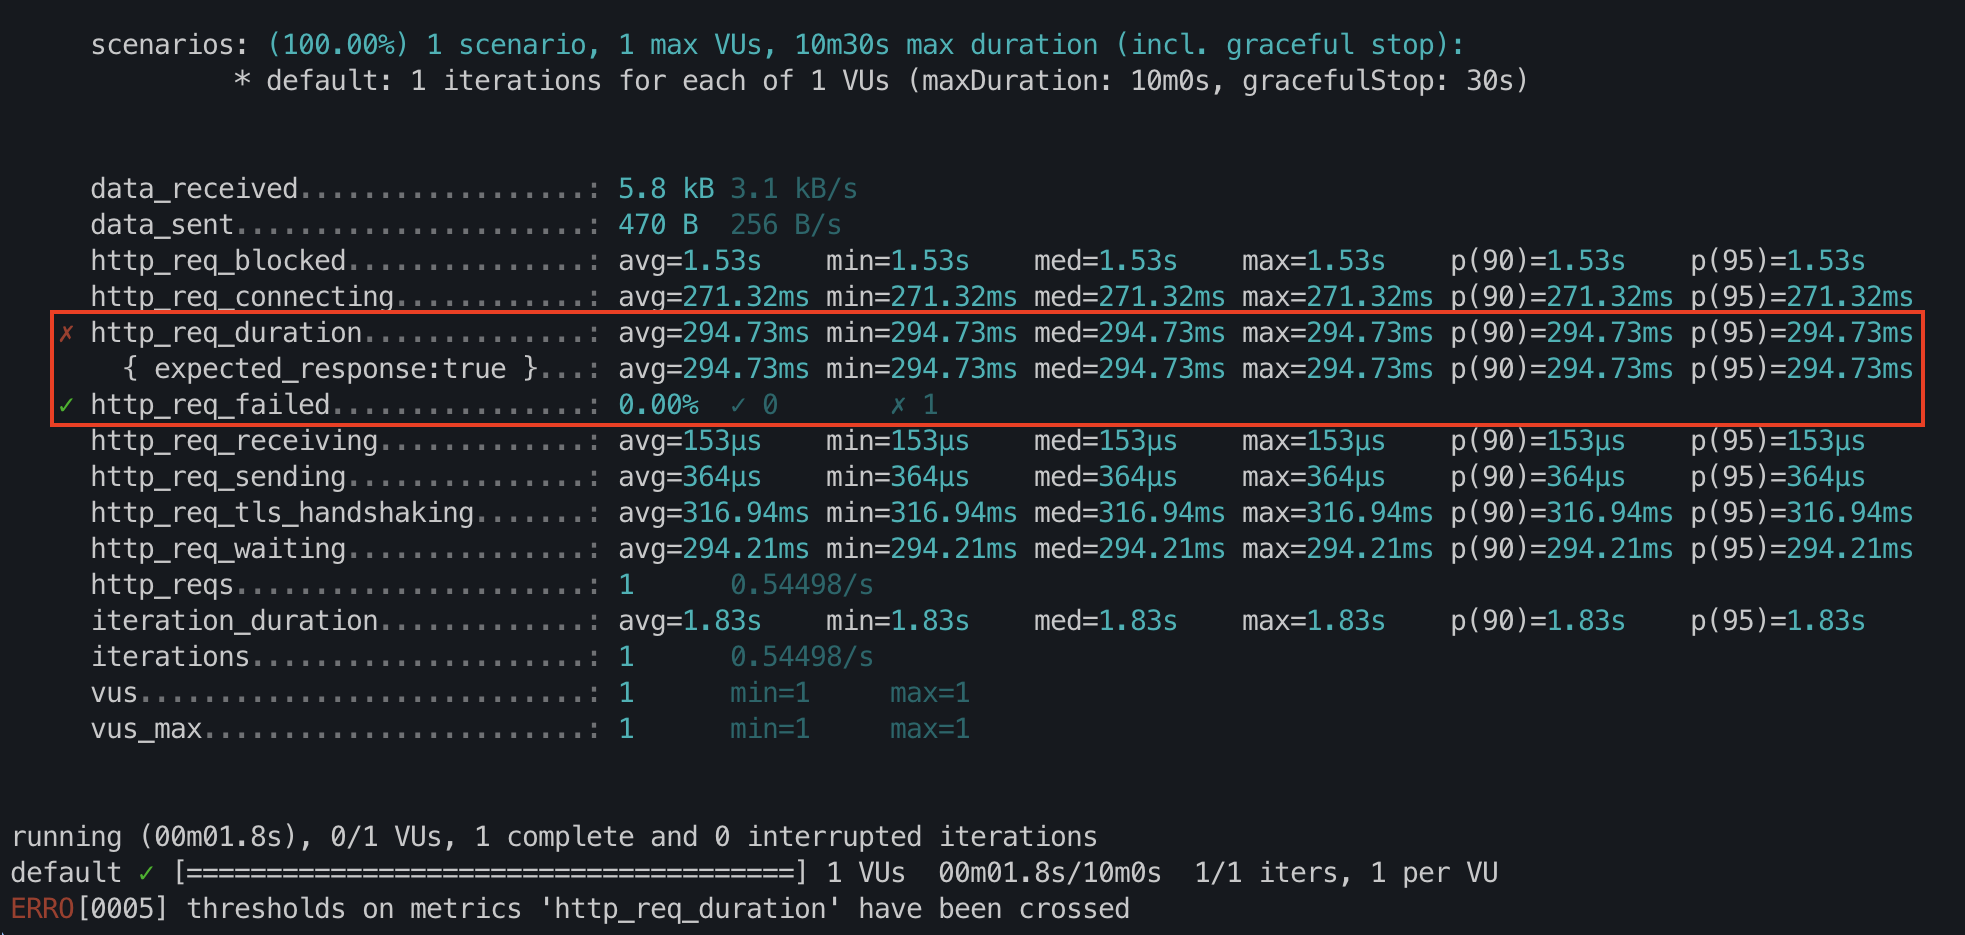
執行結果
Metrics
HTTP
- http_req_sending:將資料或是請求送到遠端伺服器所花費的時間
- http_req_waiting:等待遠端伺服器回應所花費的時間
- http_req_receiving:接收到遠端伺服器回應所花費的時間
- http_req_duration:請求的總時間 (http_req_sending + http_req_waiting + http_req_receiving)
- http_reqs:總共發了多少 Request
- http_req_failed:失敗率
- iterations_duration:完成一次完整的腳本函式所花費�的時間
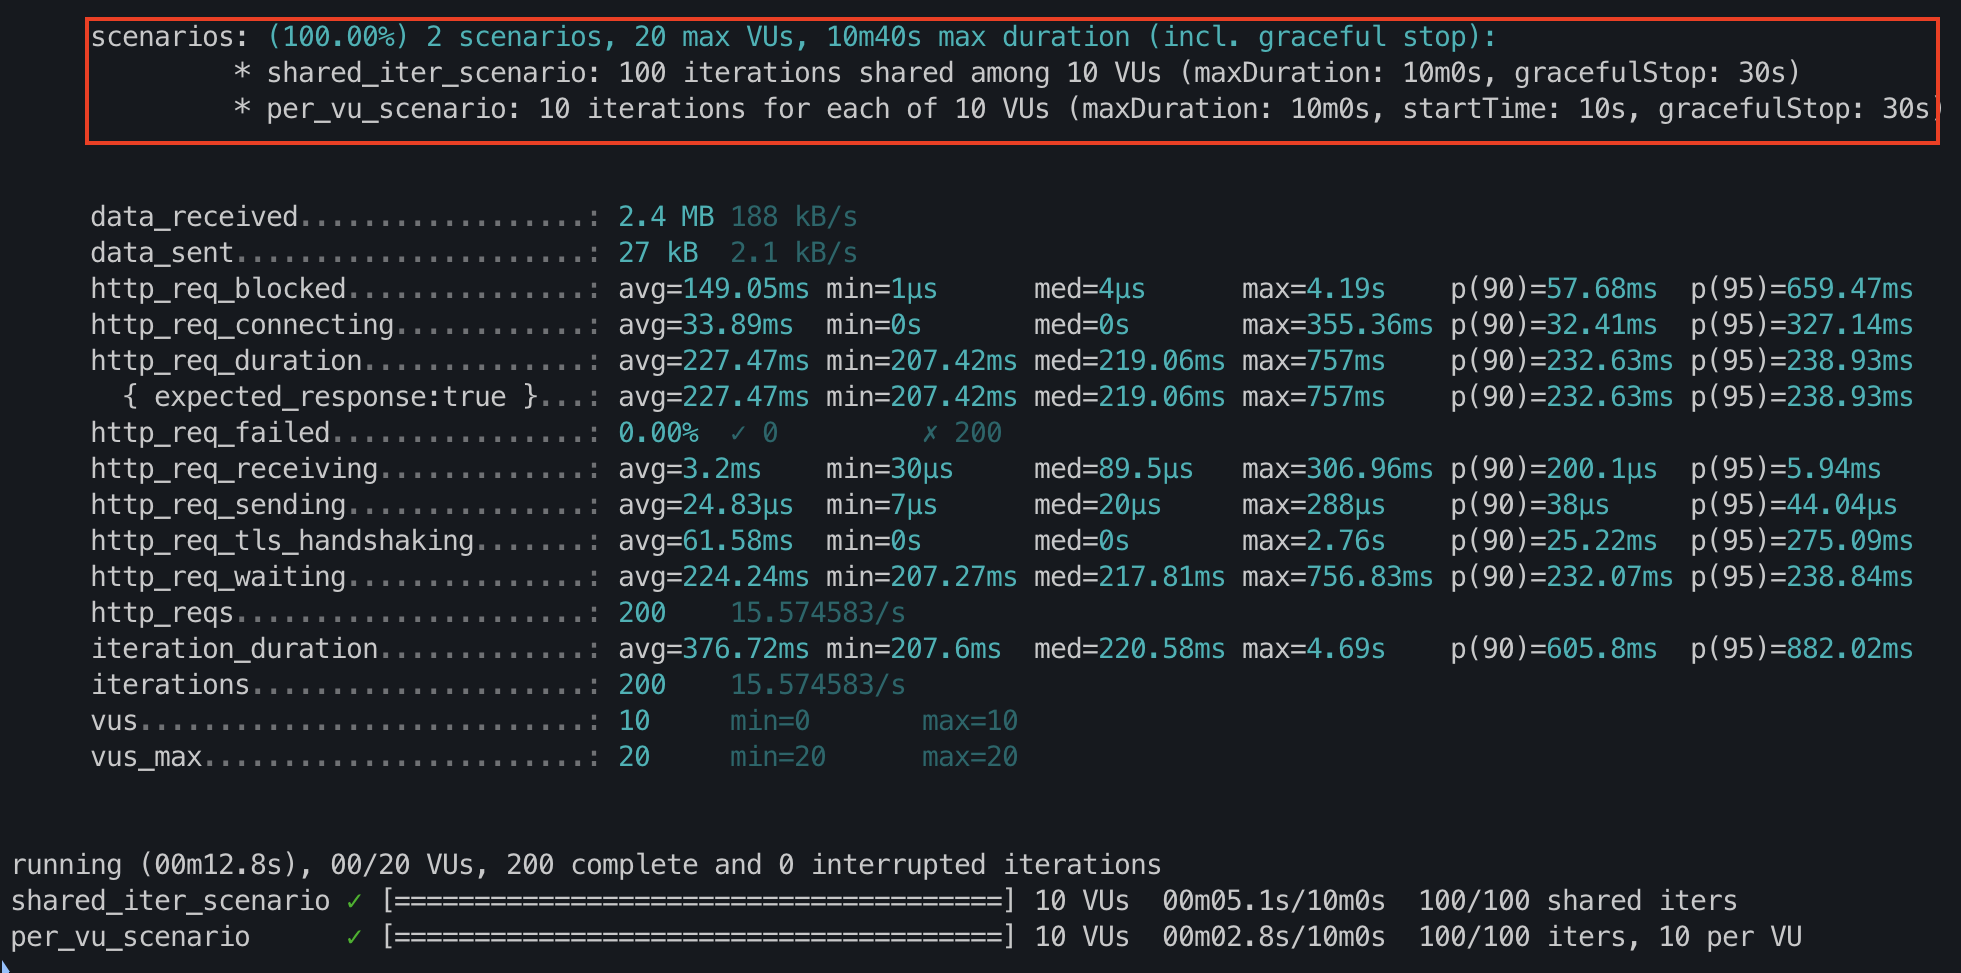
scenarios
測試情境的參數,可以對不同的場境指定名稱,並設定多種不同的參數。
import http from "k6/http";

export const options = {
    scenarios: {
        shared_iter_scenario: {
            executor: "shared-iterations",
            vus: 10,
            iterations: 100,
            startTime: "0s",
        },
        per_vu_scenario: {
            executor: "per-vu-iterations",
            vus: 10,
            iterations: 10,
            startTime: "10s",
        },
    },
};

export default function () {
    http.get("https://test.k6.io/");
}
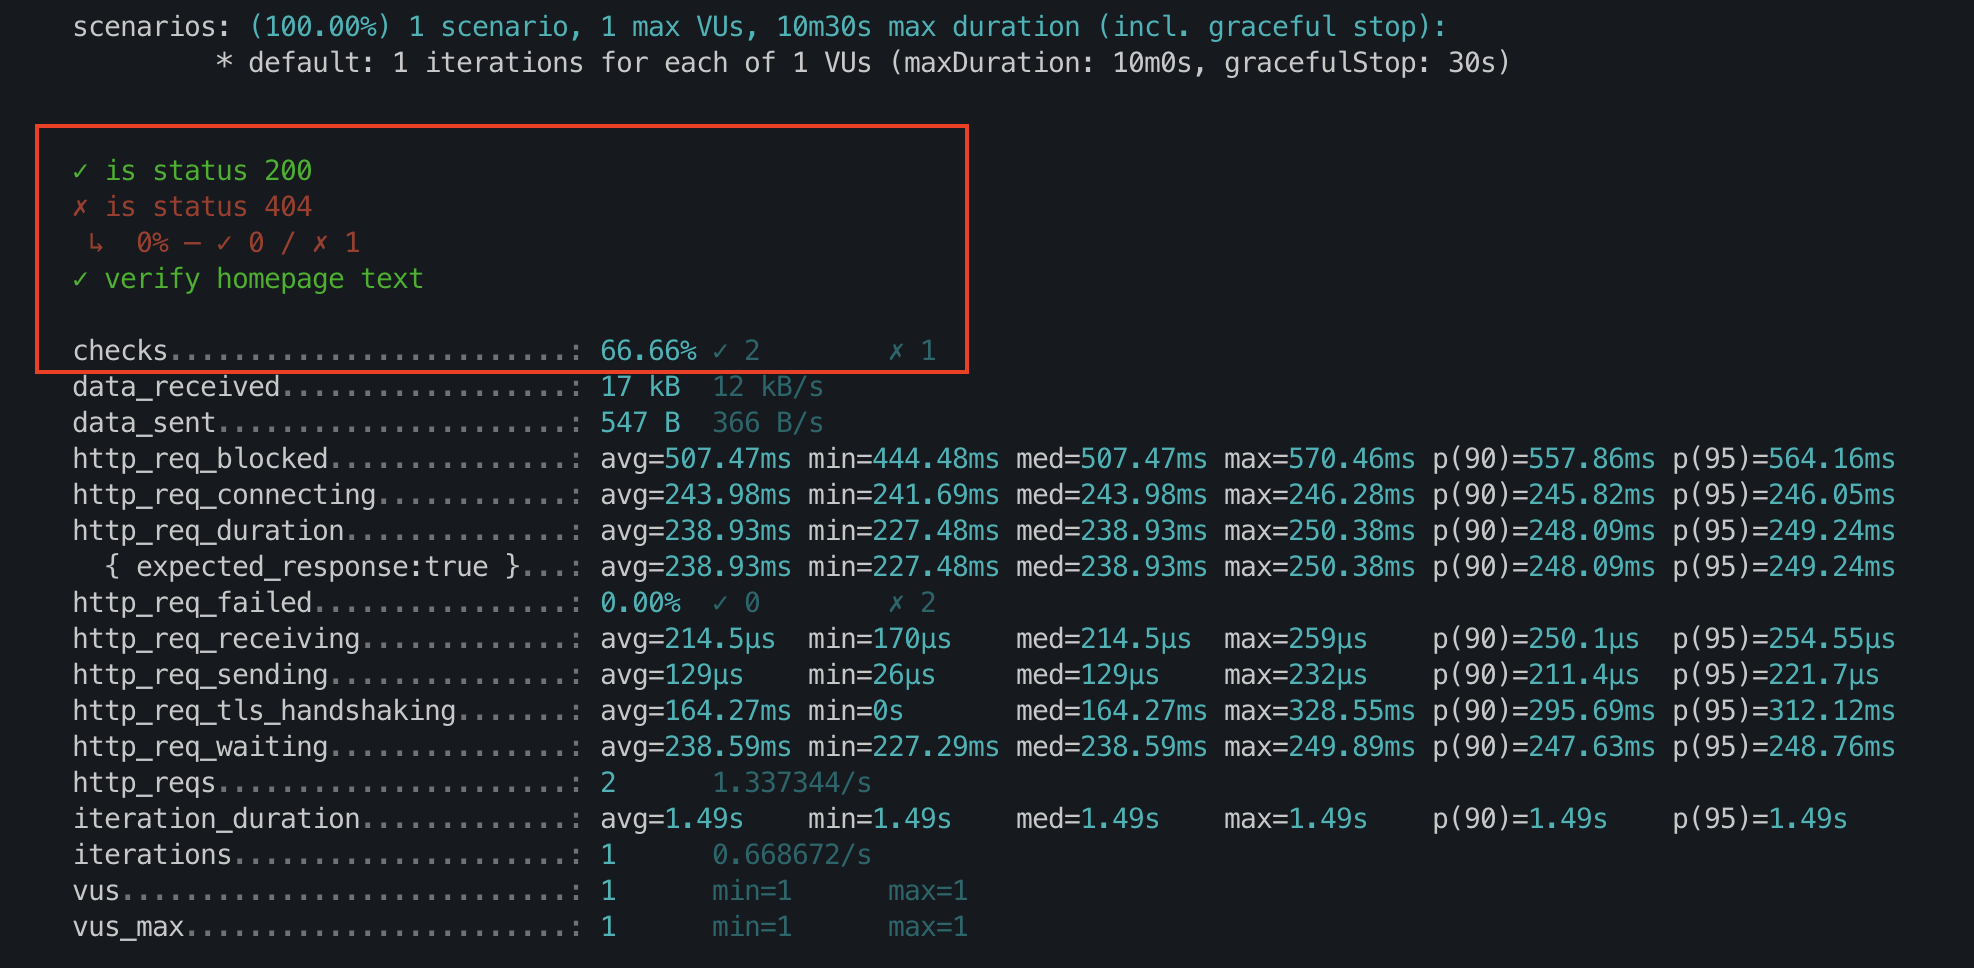
checks
類似 assert,但不論成功或失敗,測試仍會繼續執行,並且 k6 會追蹤失敗的比率。
import { check } from 'k6';
import http from 'k6/http';

export default function () {
  const res = http.get('http://test.k6.io/');
  check(res, {
    'is status 200': (r) => r.status === 200,
    'is status 404': (r) => r.status === 404,
    'verify homepage text': (r) =>
      r.body.includes('Collection of simple web-pages suitable for load testing'),
  });
}
thresholds
為測試指標定義一個通過或是失敗的標準,若測試不符合標��準,將以失敗狀態結束,又稱為門檻值。
import http from 'k6/http';

export const options = {
  thresholds: {
    http_req_failed: ['rate<0.01'], // http errors should be less than 1%
    http_req_duration: ['p(95)<200'], // 95% of requests should be below 200ms
  },
};

export default function () {
  http.get('https://test-api.k6.io/public/crocodiles/1/');
}
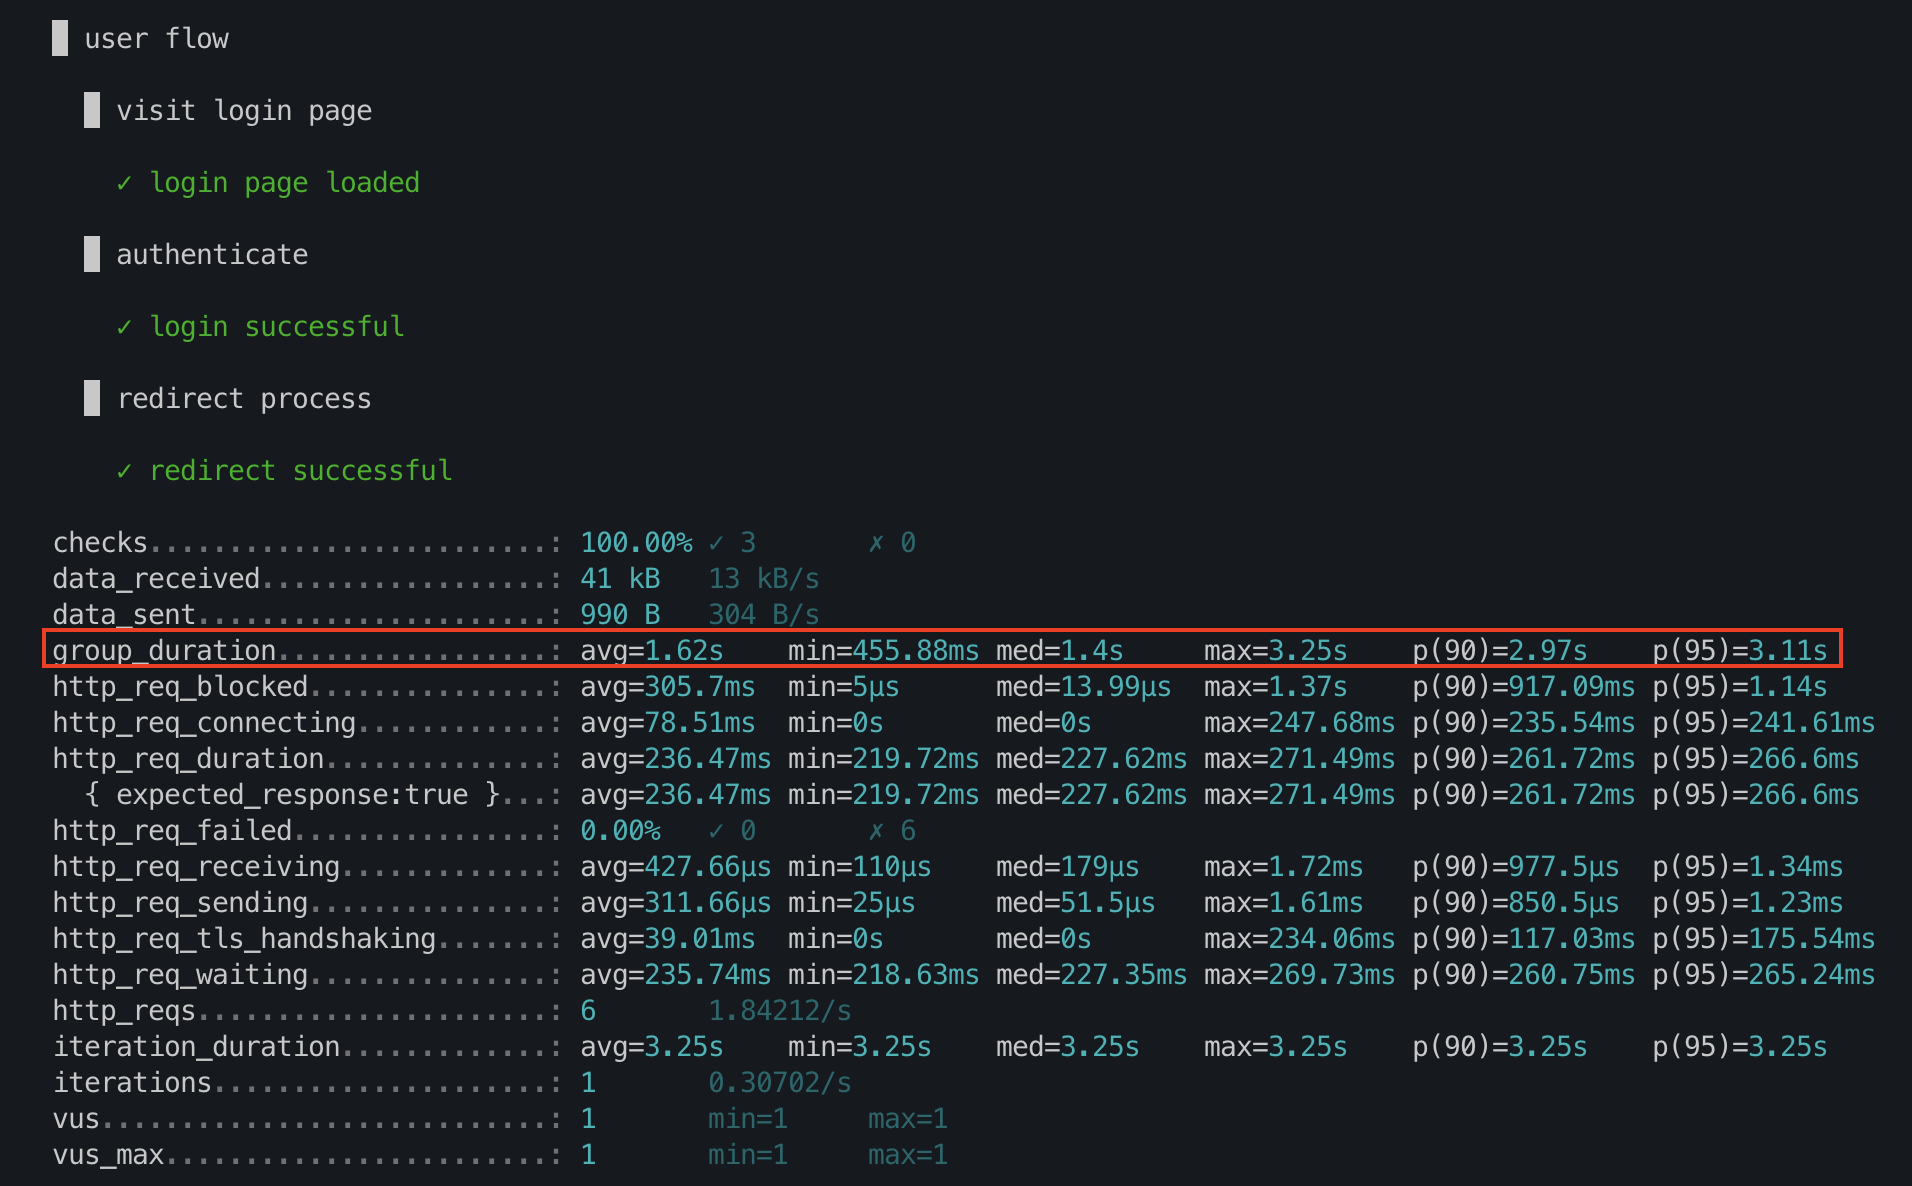
group
將同一個測試腳本,按照功能進行組裝,也可以使用巢狀分組方式來進行行為驅動開發 (BDD) 的測試。
import { group } from 'k6';

// BDD-style testing
export default function () {
    group('user flow', function () {
        group('visit login page', function () {
            // load login page
        });

        group('authenticate', function () {
            // send login request
        })

        group('redirect process', function () {
            // redirect pages by login result
        });
    })
}
對於以 group 組裝的功能,最終指標會多出 group_duration 代表 group 執行的總時間。
Integrations
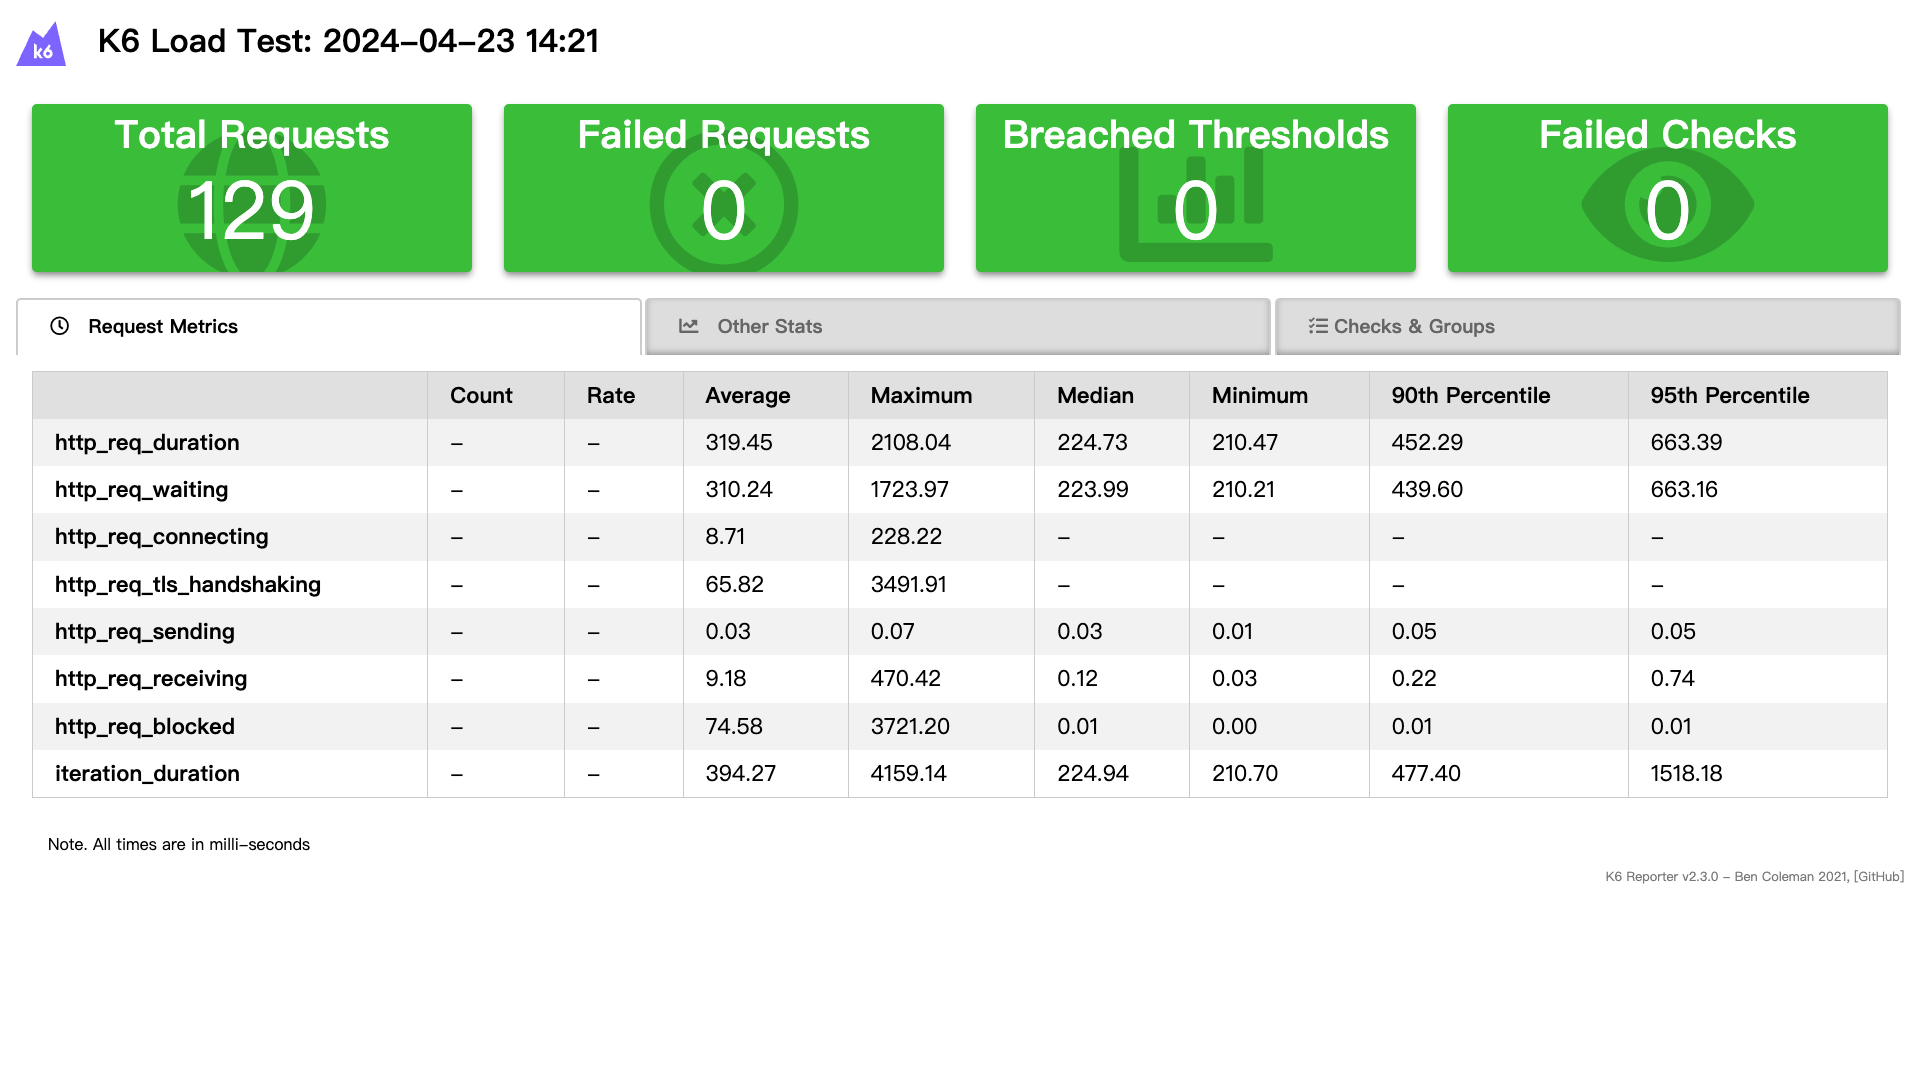
HTML Report
透過使用套件來讓結果視覺化,產生 HTML Report。
import { htmlReport } from "https://raw.githubusercontent.com/benc-uk/k6-reporter/main/dist/bundle.js";

// your k6 script

export function handleSummary(data) {
  return {
    "summary.html": htmlReport(data),
  };
}
重新運行 k6 run ./script.js,會在資料夾根目錄下產生 summary.html,打開後會看到包含所有詳細資訊:
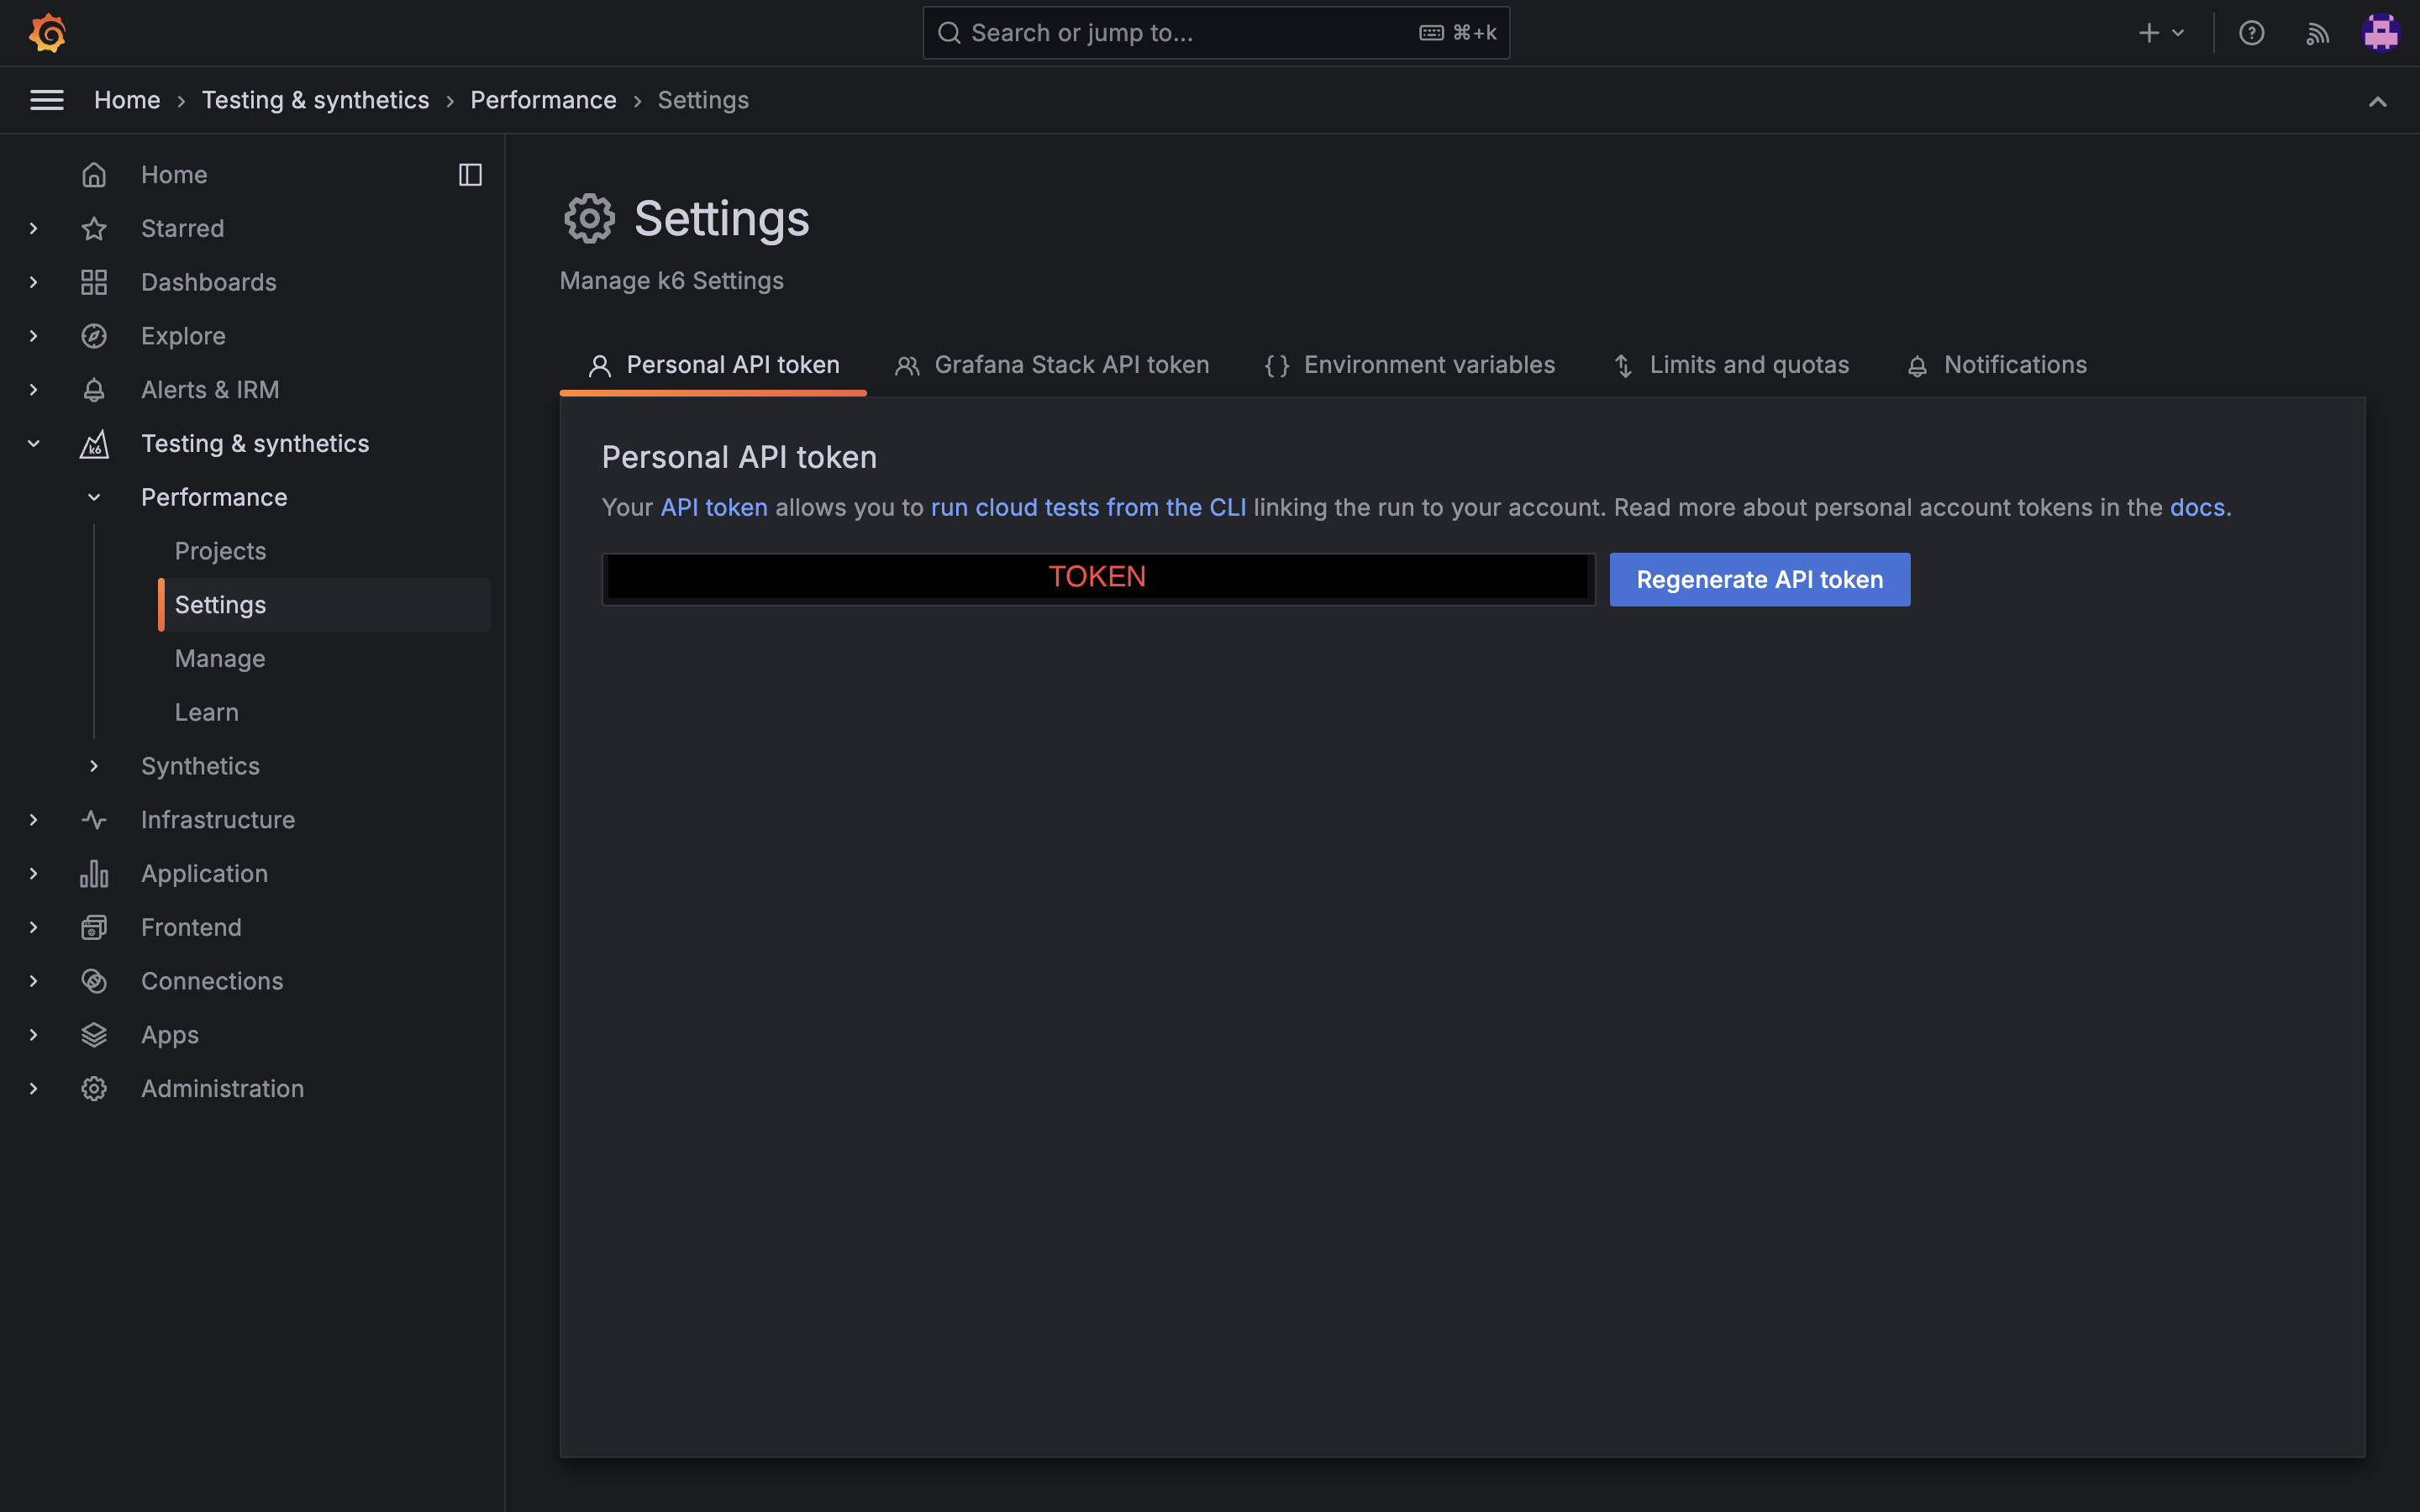
Grafana Report
能夠將本地的測試結果傳送到雲上,並且能夠在網頁應用程式上即時視覺化和分析結果:
- Grafana Cloud k6
- k6 Cloud (僅適用於現存的客戶)
- 登入雲端服務 (需要在 Grafana Cloud k6 或 k6 Cloud 取得 Token)
k6 login cloud --token <your_token>
- 運行測試並上傳結果,本地結果會顯示出報告位置:
# -o  是 --out,將結果上傳到雲上
k6 run -o cloud ./script.js

# output
execution: local
    script: ./script.js
    # 取得報告位置
    output: cloud (https://winnielinn.grafana.net/a/k6-app/runs/2691570)
- 在 Grafana 上檢查結果
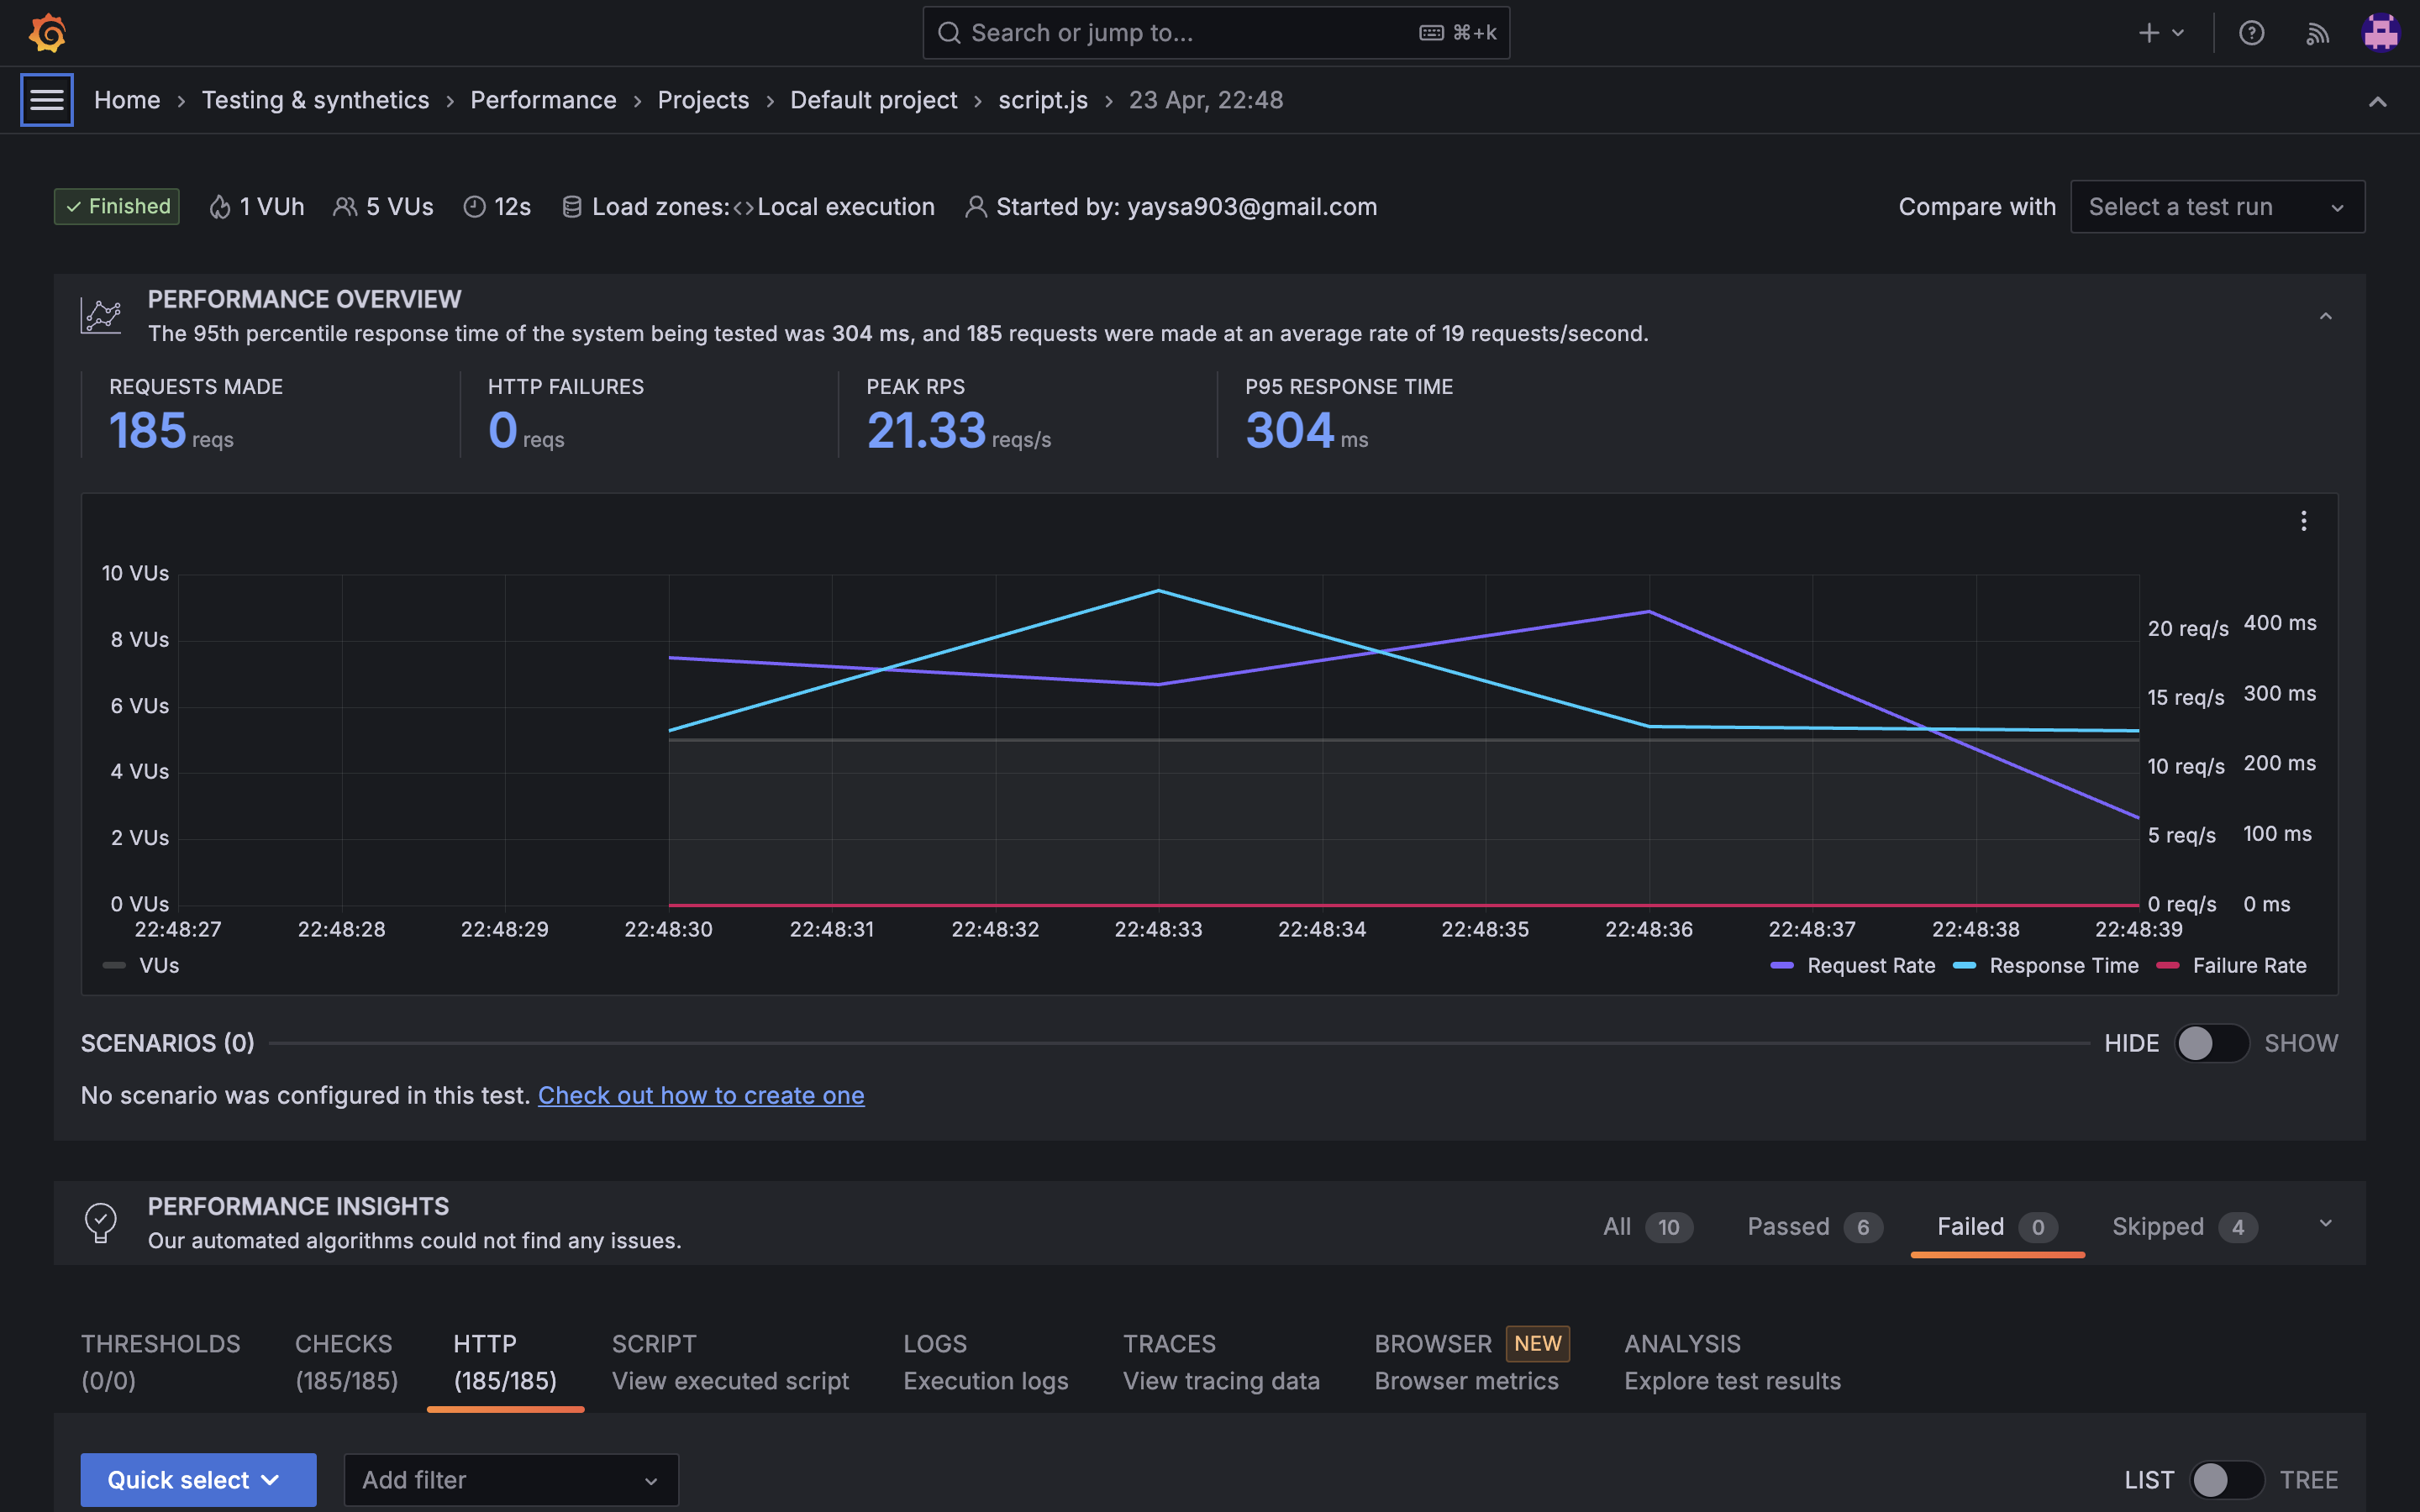
CI/CD Pipeline
讓壓測腳本在 CI/CD Pipeline 時被觸發。
-
GitHub:
.github/workflows/performance_test.yamlname: Performance Test
on:
push:
branches:
- main
jobs:
k6_load_test:
name: k6 Load Test
runs-on: ubuntu-latest
steps:
- name: Checkout
uses: actions/checkout@v1
- name: Run local k6 test
uses: grafana/k6-action@v0.2.0
with:
filename: script.js
# 加上這兩行,可以將結果直接匯出到 Grafana 上
# cloud: true
# token: {{ secrets.K6_CLOUD_API_TOKEN }} -
GitLab:
.gitlab-ci.yamlk6:
tags:
- "docker"
image:
name: loadimpact/k6
entrypoint: ['']
script:
- k6 run script.js